
Getting data from the World Bank
In Data Fundamental, we address the question of how healthcare spending affects life expectancy around the world. This is one of the answers we can find looking at data from the World Bank.
Walkthrough: Downloading Data from the World Bank
- Open the World Bank data portal: it lives in http://data.WorldBank.org
- Select
Data Catalogfrom the menu on the top.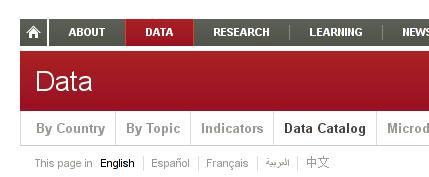
- In the long list on the bottom find “World Development Indicators”
- Click on the blue
databankbutton next to it.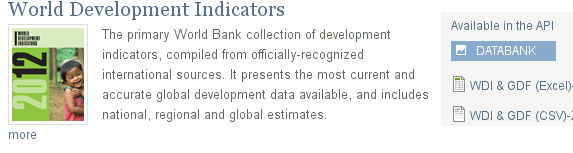
- You’ll find a very different site: The Databank - The databank is an interface to the World Bank database. You can select what data you want to see from which countries for what period of time.
- First select the countries. We’re interested in all the countries click on
select allin the country view and then onnext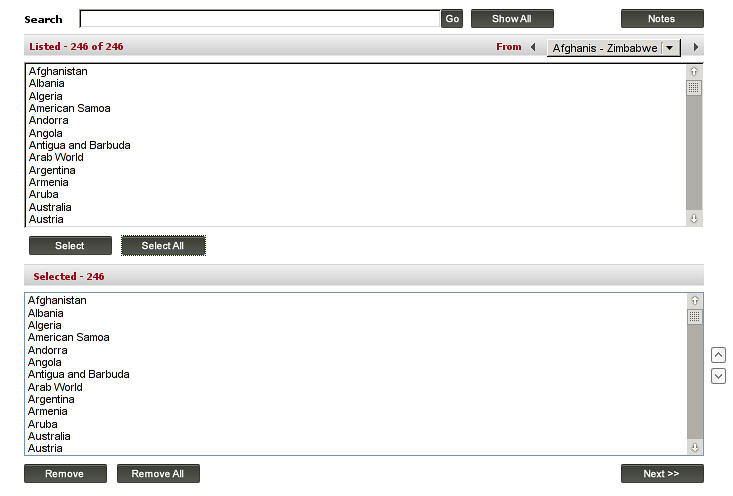
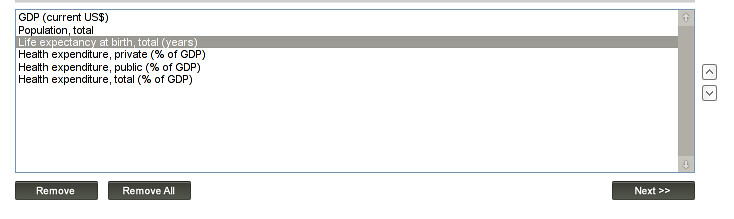
- Now you’ll see a long list of data series you can export. We’ll need a few of them.
- First we are interested in healthcare expenditure so type “Health” in the little search box on the top of the list and click
Go - Select “Health expenditure, private (% GDP)”, “Health expenditure, public (% GDP)” and “Health expenditure, total (% GDP)”. And click on
Select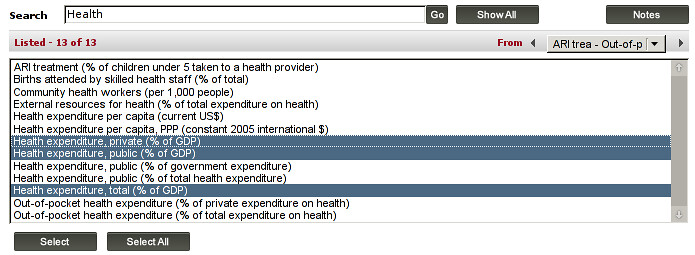
- Since the expenditure is in % of GDP we’ll need to get the GDP as well. Since we want to compare countries directly we’ll need GDP in US$. To do this type GDP into the search box and find the entry “GDP (current US$)”
- If we want to see how healthcare expenditure affects the life expectancy we need to add life expectancy to the data.
- Now let’s add one more thing: Population - like this we can calculate how much is spent by and on an average person. Search for “Population” and select “Population, total”.
- Bring GDP and Population to the top with the arrows on the side of the list, your selection should now look like this:
- Click on
Nextto select the years we are interested in. - To keep things simple, select the years 2000-2012 (you can do multiple selections by either pressing
ctrlorshift). And clicknext, - You’ll see an overview screen now on the top left there is a rough layout of how your downloaded file will look like. You’ll see “time” in the columns bit and “series” in the rows bit - this influences how the spreadsheet will look like.
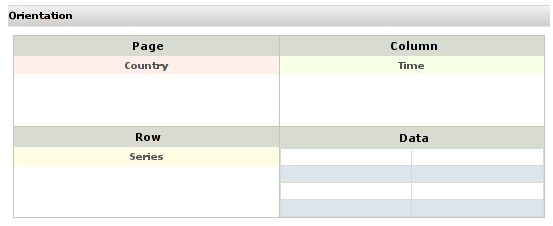
- While this might be great for some people: The data is a lot easier to handle if all of our “series” are in columns and the years are different rows. So let’s change this.
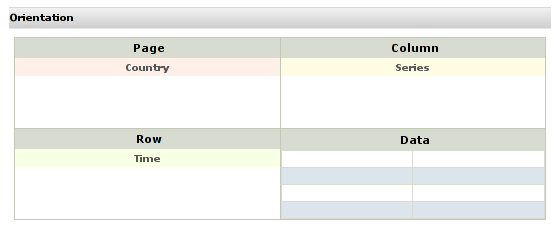
- Simply drag the “time” from columns to “rows” and the “series” from rows to columns
- Your arranged organization diagram should look like this:
- Now let’s go and
Export - If you click on the
Exportbutton a pop up will appear asking you for the format. SelectCSV. - You will then be able to download a file - store and name it in a folder so you remember where it comes from and what it is for.
- Improve this page Edit on Github Help and instructions
-
Donate
If you have found this useful and would like to support our work please consider making a small donation.