Publishing our results
Now let’s go ahead and publish our results on a webpage. This will get a bit techy but don’t worry we’ll guide you through. We will create a small web page containing some of the visualizations we created using a simple online tool called pastehtml. Pastehtml allows you to create html websites easily by simply editing the text online and then saving it for sharing.
Walkthrough: Presenting our information as a webpage
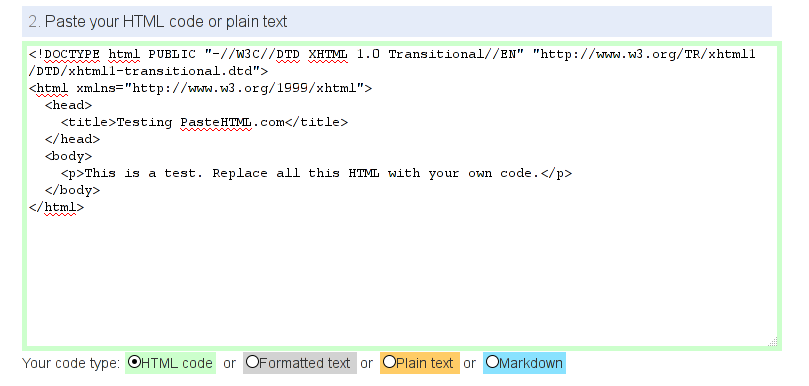
- To start a webpage simply visit pastehtml.com
- See the input box with all the brackets? This is html code and we’ll be editing it to present your results. (If you want to learn more about html code head to the school of webcraft

- First let’s change the title of the webpage: This is the bit between
<title>and</title>. Edit it so it is appropriate. - Then let’s go and edit the content for a webpage (this is the part between
<body>and</body>). See the text between<p>this defines a paragraph. Go ahead and edit it! - You can click on
Publish pageto see how your page will look like (approximately). - On the top you’ll always have the possibility to go back and edit.
- Now let’s add some charts we made.
- Go back to one of the charts in the spreadsheet.
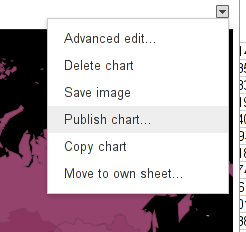
- Click on the chart. See the small triangle top right of the chart: this is the options menu.
- Go and select
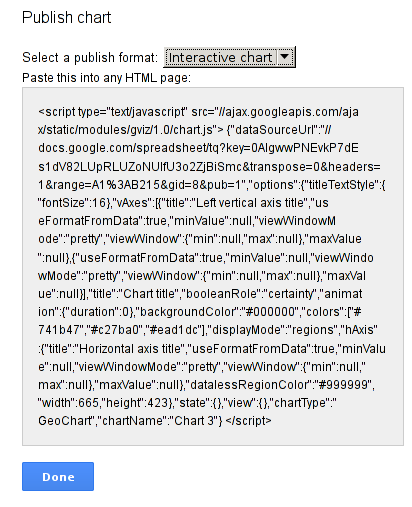
Publish chart'85. There will be a popup with a lot of code in a grey box:
- Copy this code and paste it into the pastehtml (somewhere between
<body>and</body>). Now if you go and look at your page, the chart should be there.
- Once you are finished, click on publish and you’ll get a url to your webpage. use this to share your results with your friends.
Of course if you already have a blog or something similar you can share the results there
- Improve this page Edit on Github Help and instructions
-
Donate
If you have found this useful and would like to support our work please consider making a small donation.
