
Open Data QA - the Aid Transparency Tracker
Back in April, I wrote on the Open Knowledge Foundation main blog to launch the first component of our Aid Transparency Tracker, a tool to analyse aid donors’ commitments to publish more open data about their aid activities.
At the end of that post, I pointed to our future plans to also monitor the quality of publication. It is possible to do this programmatically because donors have agreed to publish their data according to the IATI Standard.
![]()
Over the last six months we’ve spent a lot of time building a framework for testing the quality of aid donors’ IATI data, as well as a survey tool to capture data not available in the IATI format. We launched this to donors last month.
We will be releasing the results as part of our 2013 Aid Transparency Index in October. In the meantime, I wanted to give a sneak peak of some of the things the Tracker can now do. All the source code is on Github.
Automatic testing framework
![]()
The biggest part of this tool is the automated data quality analysis. This works as follows:
- Tests: A series of tests is written in FoXPath (“a cunning version of XPath”), a language we created for this purpose. The idea was to make the tests a bit more readable for non-programmers, agnostic about the language used to run them, and structured so that regular expressions could implement them in whatever language is required.
- Registry: The IATI Registry (a CKAN instance) is queried to check for any changes to the data. The Registry uses CKAN Archiver to create a hash of each package every night.
- Testing: all of the tests are run against each package found for testing. This is run as a background process, with RabbitMQ used for the queue.
- Results: Each result is stored as a pass, fail, or error, alongside the package id, the test id, the publishing organisation’s id, and the activity identifier (if applicable and available).
- Aggregations: results are then aggregated up to create a percentage of passes for each test for each package.
- Indicators: when presenting the results in the user interface, tests are grouped into indicators to make the information more readable. At the moment, there is only one set of indicators (our 2013 Index indicators), but some fairly small changes would make it possible to add other sets of indicators - for example, indicators that show whether data is good for an Aid Information Management System, or for making maps with, or for results data.
Remaining hurdles
- Improving tests: The tests need to become more expressive, adding more conditions to when they should or shouldn’t be run. Some of these expressions are supported within the existing version of FoXPath.
- Changed packages: Refreshing packages currently has to be done manually, because of the way the IATI Registry records changes to files. This should be fixed within the next couple of weeks.
- Space: The data quality tool currently stores the result for each test alongside each activity. This uses 15GB of space each time it runs. I’m considering dropping this data, and only storing the aggregates, because such detailed data doesn’t appear to be as useful as I originally thought it might be.
- Speed: testing is quite slow at the moment, and aggregation takes a particularly long time. I’m going to revisit that section of the code (and in fact the aggregation architecture as a whole) to optimise it. However, in the medium term, some more substantial changes might be needed, possibly including re-writing this component in a compiled language.
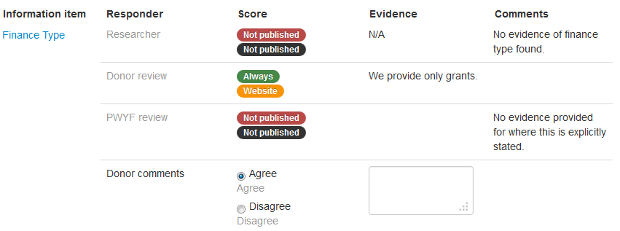
Survey component
![]()
In previous years, we used Global Integrity’s Indaba platform for the survey. However, because of the quite different way this year’s Index is constructed, we decided to build our own bespoke survey tool.
Many of the donors we include in the Index have not yet begun publishing data to IATI, and none of them are yet publishing all of the fields. We need to capture this information in the Index, while encouraging donors to publish as much as possible in their IATI data.
What it does
- Donor-specific indicators: if information is found in the donor’s IATI data, then there’s no need to ask again where that information can be found. If it’s not found at all in the IATI data, then we look to see where else we can find that information on a donor’s website.
- Format matters: more accessible formats are scored higher in this year’s Index. We’re encouraging donors to move as much information out of PDFs into websites, then into CSV, Excel, or some other machine readable format, and then into the IATI-XML format. Obviously, it’s great if they can jump steps and go straight to IATI-XML - we’re seeing that from several donors this year.
-
Retaining an audit trail: Each of the steps in the survey are recorded and will be published, so that if there are disagreements between us, the donor, or the independent reviewer, then readers can see that correspondence and reach their own conclusions.
How it works
- When a new survey is created, indicators are only created if they score 0 in the IATI data quality assessment.
- When a user has finised responding to the survey, they submit the form and a simple linear workflow moves the survey to the next step.
- Users have access to specific parts of the workflow for a specific organisation, depending on whether they’re a donor or an independent reviewer, and whether they should have edit permissions or read-only permissions.
What we’re aiming to achieve
Finally, it’s worth emphasising what we’re trying to achieve from all of this, and looking at the extent to which we’re doing that already.
- Non-IATI publishers begin publishing to IATI: the incentives in the Index are very clearly structured this year: more points are awarded for publishing in more open formats, with the internationally comparable IATI standard format scored highest. Several donors are trying to start publishing by the July 31st deadline, which is when automated data collection will end and we’ll begin writing our analysis.
- IATI publishers publish more fields, and improve their data: several donors are working to add more fields into their data where they have that information to hand.
- Donors can use the data quality tool to improve their own publication: several donors are using the tool to flag areas where there could be improvements in their data. We want this tool to be useful on an ongoing basis to donors, but that will require both that tests run nightly, and also that donors can test unpublished data. We’ll be working on those features over the next month.
What’s next
We’ll be presenting the Aid Transparency Tracker at OKCon in Geneva in September, and talking about how it could be used as a basis for monitoring the quality of data in other open data spending standards.
We would also very much welcome any feedback. Please get in touch:
- Email: [email protected]
-
Twitter: @mark_brough
 We make tools, apps and insights using
open stuff
We make tools, apps and insights using
open stuff


Comments