
Making puzzles out of Shapefiles - bringing Open Data to the physical world
For a while I’ve been thinking about how to make Open Data more tangible. Even with great visualizations, it tends to remain stuck in computers and smartphones. Recently, I had the idea to start taking geodata, released by cities, and start making it into physical things. This is the first steps and prototypes: Making a puzzle out of district borders.
Thanks to the Open Week organized by OKFN Austria member Stefan Kasberger I finally got the chance to put this idea into action. Here’s what we did:
- First download the city boundaries as Shapefile
- Make sure it’s WGS 84 EPSG 4326 formatted
- Convert it to SVG using kartograph.py
- Convert it to PDF - so the lazercutter can understand it
- Adopt the PDF for lazercutting (set line-widths to hairlines…)
- Cut!
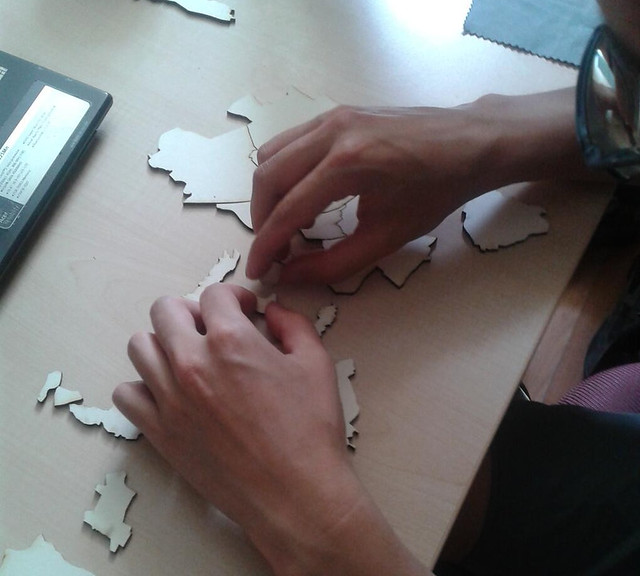
- Try to assemble the puzzle
To make the process a little easier Stefan created a script for converting shapefiles to svg with the data.
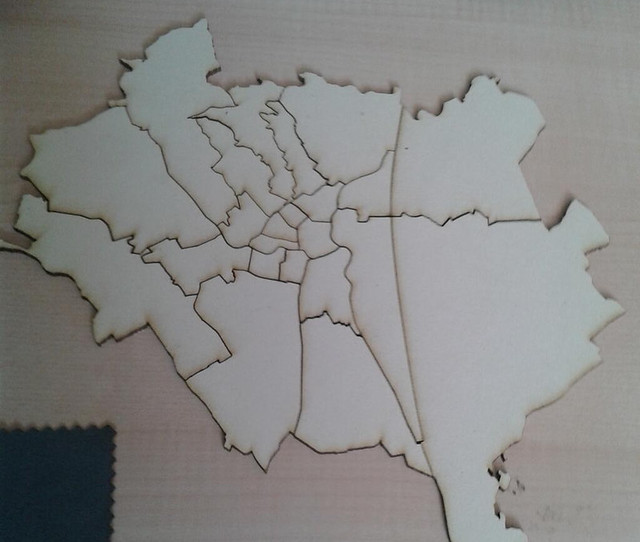
We created puzzles for both Vienna and Graz using district boundaries released as Open Data. Once done, we noticed that solving a district boundary puzzle is not as easy as it seems… (even though the number of pieces are limited)
 We make tools, apps and insights using
open stuff
We make tools, apps and insights using
open stuff


Comments