OLAP Cubes and Logical Models
Last time we talked about OLAP in general – what it is and why it is useful. Today we are going to look at the data – how they are structured and why? What are cubes? What does it mean “multi-dimensional”?
Data Cubes and Logical Model
Application data might be a mess from user’s perspective. Not only that, data might be scattered all around the place in multiple systems. Even when the data would be put into one place called “data warehouse”, they will still have their original form which is not ready to answer our questions quickly. Purpose of the logical model is to hide physical structure of the data (how applications use it) and provide user-oriented view of the data (how business sees it).
“Answering questions quickly” does not depend only on database performance and amount of data. We might have the fastest database and computation engine in the world, but we will not get the answer quickly because it will take weeks to properly translate the human (business) question into technical terms. The challenges are:
- Where are the data stored? What table? Which column?
- What are the categories and what can I summarize?
- What are the relationships between columns?
- Is this
category_idcolumn the same as thispk_prod_cat? - Does this column contain a key (which is unique) or is the a label (which might be not, due to data evolution)?
- How can I group the data?
All this information is collected in metadata called logical model. Analysts or report writers do not have to know where name of an organisation or category is stored, nor he does not have to care whether customer data is stored in single table or spread across multiple tables (customer, customer types, …). They just ask for “customer name” or “category code”.
Cubes
The data structures used in the OLAP are multidimensional data cubes or OLAP cubes:
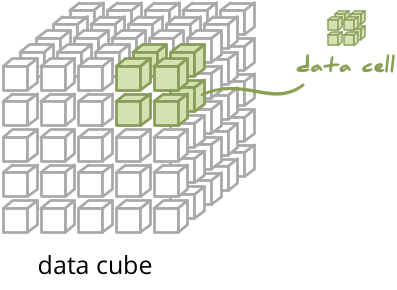
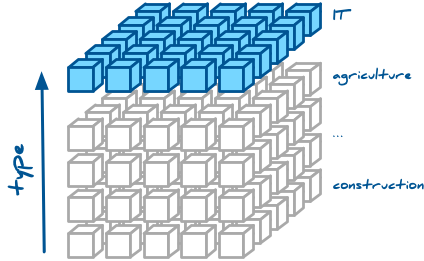
Cube is a data structure that can be imagined as multi-dimensional spreadsheet. How we can imagine it? Take a spreadsheet, put year on columns, department on rows – that’s two-dimensional cube. Now create multiple sheets with data of the same structure, say one sheet per country. Now you have three-dimensional cube.
Facts and Measures
Fact is most detailed information that can be measured.

Example of a fact might be a contract, a spending, a phone call, a visit. We can measure:
- contract: financial amount, discount, planned amount
- spending: financial amount, quantity
- phone call: duration, cost
- visit: duration
Those measurable properties, such as amount, discount or duration are called measures.
We are mostly interested in summarized view: “what was the overall spending?”, “what is the average call duration?” or “how many contracts are there?” Those computed values are called aggregates or aggregated measures.
Facts might have multiple measures or they might even have none. If there are no measures we still can at least answer questions of type “how many?”.
Note: The terminology might differ slightly in various literature and systems. For example, Microsoft calls measure a measure group and they label aggregates as measures.
Dimensions
OLAP is suitable mostly for data which can be categorized – grouped by categories. The categorical view of data should be also the main interest of the data analysis. Example of categories might be: color, department, location or even a date.
The categories are called dimensions.
Dimensions provide context for facts:
- Where did that happen?
- When was the contract signed?
- What kind of goods or services was in the contract?
Dimensions are used to filter queries:
- What was the spending last year?
- How many contracts signed by the department of Health?
They are used to control scope of aggregation of facts:
- What was the number of contracts by department?
- What was the average visit duration per month?
- What are the sales of each product?
Concept Hierarchies
We might be interested in amount per year, then per month for particular year; products can be grouped by categories and subcategories; location might be defined by country, country might have multiple cities… Those are concept hierarchies of dimensions.
Hierarchy has multiple levels and there might be various hierarchical views of any dimension. For example the date might be split by year, month and day. Or it might be split by year, quarter, month and no day (because we have no daily data) or by year and week (for weekly data).
From technical perspective you might associate an attribute with a dimension. Depending on the modelling method a dimension might be composed of just one attribute or multiple attributes grouped by hierarchies.
Note: there are multiple approaches to concept hierarchies. The one described here is: Dimension might be composed of multiple levels and the levels are grouped into hierarchies. Another approach might be “hierarchies are lists of dimensions” where a dimension represents just single attribute.
Slicing and Dicing
We have a data cube full of facts, how can we explore the data? We slice the cube! What does that mean?
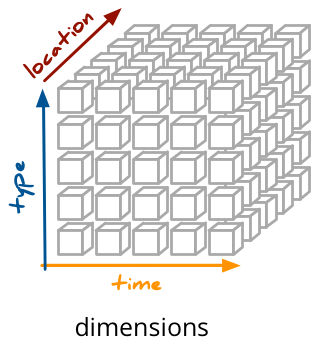
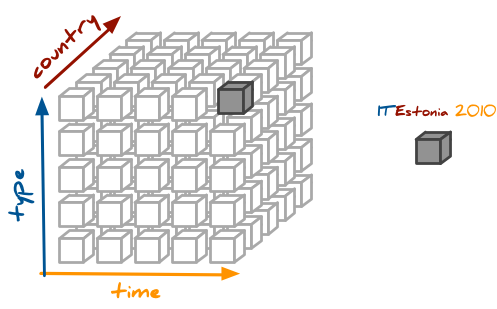
Say we have a data cube of contracts with dimensions: time, country and type (of procured subject)
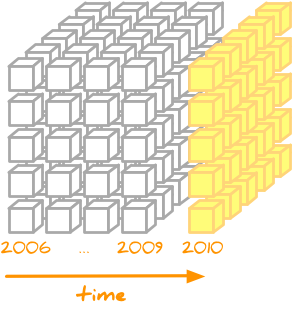
We might be interested in spending in 2010:
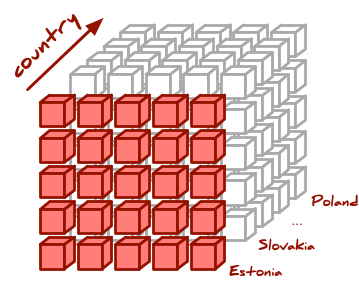
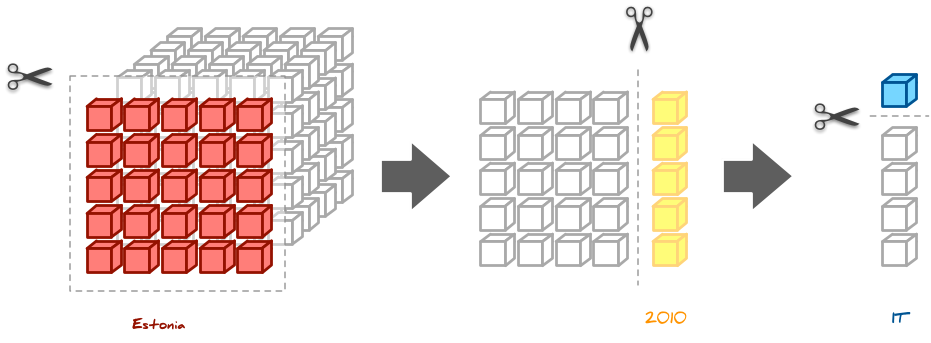
… or contracts in Estonia:
… or contracts in Estonia in 2010:
… or just IT contracts in general:

IT contractsin Estonia in 2010:
Some OLAP systems might have this information readily available in a pre-computed (pre-aggregated), therefore we might get the answer very quickly despite of huge amount of original data. Even if the system does not store the pre-aggregated data cells, it might use some other transparent tricks to achieve fast responses.
Slicing and dicing is an operation that filters the data cells of a cube and narrows our focus from broader view:
Drilling down
How many contracts per year? or Which type of products was most wanted in 2012? are kind of questions that are answered by “drilling down” through the data. Drilling down means changing our focus to more detailed data.
Drilling down can be done by concept hierarchies – for example going from year summary to month summary to daily sales or by going from country level to regional level.
The opposite operation is called “roll-up” – for example going from a monthly view to a yearly view.
Try It
You might try OLAP with light-weight Python framework Cubes. I’ll be talking about the framework in more details in the future, meanwhile here are the main features:
- ROLAP – OLAP on top of relational database
- quick prototyping on top of existing database schemas
- metadata driven with user-oriented metadata
- localizable
- OLAP API with HTTP server
- no need to know Python
The development version includes pluggable datawarehouse (cubes from external sources) and many new backends such as MongoDB.
For reporting and data exploration you might use CubesViewer. More visualisation software being developed.
Summary
Concept of OLAP cubes and multidimensional modeling brings more understandable and usable data to the end-users. It very easy and straightforward to translate business questions into multidimensional query.
The OLAP systems, thanks to the nature of multi-dimensional data cubes, can prepare data by aggregating them up-in-front to provide answers faster.
Moreover, explicit metadata (logical model) allows not only more flexible data navigation but also easy transformation of the data to be used in various reporting software. Some OLAP tools can work with certain database schemas immediately.
To sum it up in few words, the multidimensional modeling of OLAP cubes brings: understandability, better usability, speed and logical data reusability.
Next time we will look at the Cubes – Lightweight Python framework – how to have an OLAP server running “in 15 minutes”.
 We make tools, apps and insights using
open stuff
We make tools, apps and insights using
open stuff


Comments