
Building 2030-watch.de: measuring progress towards the sustainable development goals (SDGs)
For the last 15 months the Open Knowledge Foundation Germany has been working on a prototype to monitor progress towards the sustainable development goals (SDGs) from an independent, civil society-led perspective. There’s a detailed blog post on why such independent monitoring is necessary at our blog. To give a quick example, the UN Commission agreed to measure the tax revenue generated by low-income countries but doesn’t propose an indicator to measure the financial secrecy of European countries, for example encouraging tax evasion. At 2030-watch we have the Tax Justice Network as our data partner providing an indicator on this topic. The Tax Justice Network also collaborate with Open Knowledge on tax justice.
Due to “cherry picking” of indicators, there is a high risk that the ambition of the 2030 Agenda is watered down at the monitoring stage. This is why we have created 2030-Watch: a tool that focuses on high-income countries and highlights through a visualisation tool which countries are doing well at achieving which goals using over 60 indicators using data from official sources like Eurostat and the OECD and also from civil society organisations. The results might surprise you, so head on over and take a look!
It’s been my pleasure to lead development work on the project the last few months: creating a workflow for uploading indicator data, reworking the site to showcase indicator “sponsors” and allowing multilingual texts. Last week we were very proud to launch the English version: 2030-watch.de/en/. The site is generated using the static site generator Jekyll. Recent Jekyll versions have a wonderful ability to ingest JSON data and make it available to templates. We’ve used this facility to make a JSON database of all indicators available to various small visualisation web applications written in AngularJS. We have recently moved from direct editing of JSON files (one per indicator) via GitHub to reading in data from standardized Google Sheets and automatically outputting JSON files as updates to the GitHub repository. This change was made to make indicator sponsorship easier for external parties. It has the side benefit of allowing conversion to CSV, ODS and XLSX formats using the Google Drive API. Source code for the website is of course open and you can take a look at batch processing Google Drive sheets at our data processing repository.
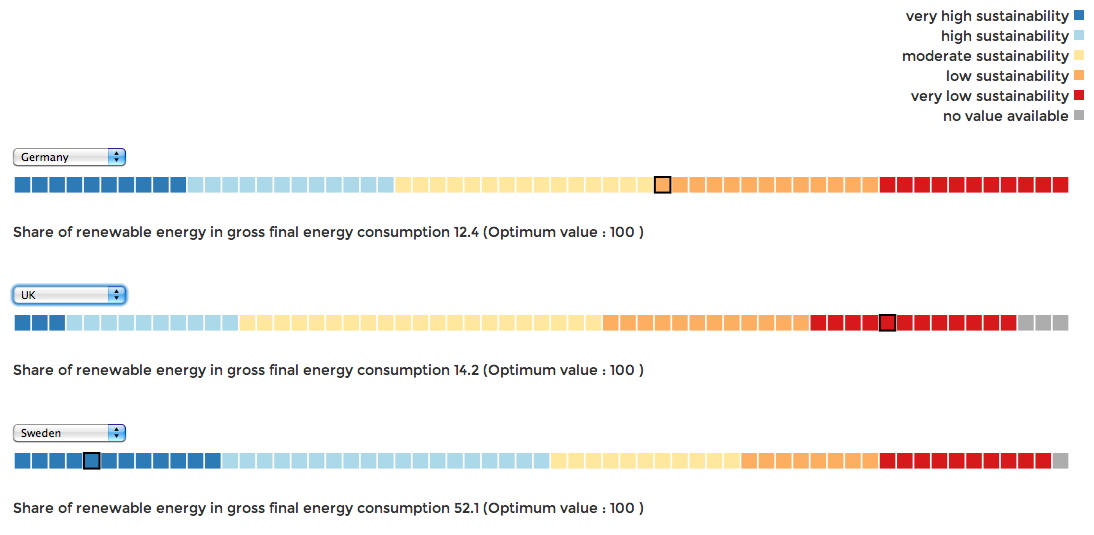 The country comparison tool shows multiple countries’ performance across all indicators in a simple color-coded fashion as well as allowing comparisons to be made between the countries for each indicator
2030 Watch is still a prototype which has been developed with scarce resources and a lot of voluntary work. We still have a lot to do and are looking for help in many areas, technical and non-technical. For example on the technical side we would love to see ideas of how the site can become even more user friendly and more informative and how the visualisations could work with up to 90 indicators, or how we could solve the problem of adapting the data tool for mobile use. For further details on how to get involved contact us at [email protected]. We are also raising financial contributions at betterplace.org. Despite the remaining challenges we feel that 2030 Watch already demonstrates that civil society monitoring is possible.
Disclaimer and acknowledgements: This post has reused some of Claudia’s longer post at 2030-watch.de. I am responsible for the development and data preparation effort carried out since September 2016. Special thanks go to fellow labs member Mark Brough who has reworked the visuals wonderfully in the last months, to Katja Dittrich who created the data visualisations and to Christian Pape who developed the first version of the site in 2015.
 We make tools, apps and insights using
open stuff
Join in »
We make tools, apps and insights using
open stuff
Join in »
 Follow @okfnlabs

Comments