
Collecting, Analysing and Sharing Twitter Data
On March 3, communities around the world marked Open Data Day in over 400 events. Here’s the dataset for all Open Data Day 2018 events.
In this post, we will harvest Open Data Day affiliated content from Twitter and analyze it using R before packaging and publishing the data and associated resources publicly on GitHub.
Collecting the Data
With over 300million monthly users [source, January 2018], Twitter is a popular social network that I particularly like for its abbreviated messages, known as Tweets. Twitter’s Standard Search API allows users to mine tweets from as far back as a week for free.
R is a popular programming language for data analysis and has an active community of contributors that add to its capabilities by writing custom packages for interacting with different tools and platforms and achieving different tasks. In this post, we will employ two such packages:
- twitteR allows us to interact with the Twitter API. We will install this from CRAN, the official packages repository for R.
- Frictionless Data’s datapackage.r library will allow us to collate our open data day data and associated resources, such as the R script in one place before we publish it. We will install this from GitHub.
To get started, create a new application on apps.twitter.com and take note of the API and access tokens. We will need to specify these in our R script.
# install and load the twitteR library

install.packages("twitteR")
library(twitteR)


# specify Twitter API and Access Tokens

api_key <- "YOUR_API_KEY"
api_secret <- "YOUR_API_SECRET"
access_token <- "YOUR_ACCESS_TOKEN"
access_secret <- "YOUR_ACCESS_SECRET"

setup_twitter_oauth(api_key, api_secret, access_token, access_secret)
We are now ready to read tweets from the two official Open Data Day hashtags: #opendataday and #odd18. With a maximum number of 100 tweets per request, Twitter’s Search API allows for 180 Requests every 15 minutes. Since we are interested in as many tweets as we can get, we will specify the upper limit as 18,000, which tells the twitteR library the maximum number of tweets to retrieve for us.
# read tweets from the two official hashtags, #opendataday and #odd18

tweets_opendataday <- searchTwitteR("#opendataday", n = 18000)
tweets_odd18 <- searchTwitteR("#odd18", n = 18000)

# view lists of mined tweets from both hashtags

tweets_opendataday
tweets_odd18
Note: run each searchTwitteR() function separately and 15 minutes apart to avoid surpassing the limit.
In the R script snippet above, we assigned results of our search to the variables tweets_opendataday and tweets_odd18 and called the two variables to view the entire list of tweets obtained. Lucky for us, the total number of tweets on either hashtag are within Twitter’s 15 minute request limit. Here’s the feedback we receive:
# tweets mined on March 7, 2018

#opendataday
 18000 tweets were requested but the API can only return 11458

#odd18
 18000 tweets were requested but the API can only return 3497
Here’s a snippet of the list obtained from the #opendataday hashtag:
[[1]]
[1] "OpenDataAnd: Con motivo del pasado #OpenDataDay, @ODIHQ nos recuerda qu<U+00E9> es y para qu<U+00E9> sirven los #DatosAbiertos<U+2026> https://t.co/Fib4rSukbs"

[[2]]
[1] "johnfaig: RT @ODIHQ: Here's our list of seven weird and wonderful open datasets (nominated by you) https://t.co/H42bV5oIhw\n\n#opendataday #opendataday<U+2026>"

[[3]]
[1] "SurianoRodrigo: RT @CETGAPue: Desde el auditorio Ing. Antonio Osorio Garc<U+00ED>a de la @fi_buap, se lleva a cabo el BootCamp #OpenDataDay, al que asisten acad<U+00E9>m<U+2026>"

[[4]]
[1] "Carolrozu: RT @CETGAPue: Desde el auditorio Ing. Antonio Osorio Garc<U+00ED>a de la @fi_buap, se lleva a cabo el BootCamp #OpenDataDay, al que asisten acad<U+00E9>m<U+2026>"

[[5]]
[1] "Josefina_Buxade: RT @CETGAPue: Desde el auditorio Ing. Antonio Osorio Garc<U+00ED>a de la @fi_buap, se lleva a cabo el BootCamp #OpenDataDay, al que asisten acad<U+00E9>m<U+2026>"
Since the entire lists are long (~11,500 tweets on the #opendataday hashtag) and hard to comprehend, our best bet is to convert the lists to data frames. In R, data frames allow us to store data in tables and manipulate and analyse them easily. twitteR’s twListToDF function allows us to convert lists to data frames. After scraping data, it is always a good idea to save the original raw data as it provides a good base for any analysis work. We will write our data to a CSV file, so we can publish and it widely. The CSV format is machine-readable and easy to import into any spreadsheet application or advanced tools for analysis.
# convert the list of mined tweets from each hashtag to a dataframe

tweets_opendataday_df <- twListToDF(tweets_opendataday)
tweets_odd18_df <- twListToDF(tweets_odd18)

# save scraped data in CSV files

write.csv(tweets_opendataday_df, file="data/opendataday_raw.csv")
write.csv(tweets_odd18_df, file="data/odd18_raw.csv")
Here’s what the first five rows of our data frame look like:
| text | favorited | favoriteCount | replyToSN | created | truncated | replyToSID | id | replyToUID | statusSource | screenName | retweetCount | isRetweet | retweeted | longitude | latitude | |
|---|---|---|---|---|---|---|---|---|---|---|---|---|---|---|---|---|
| 1 | Participan como panelistas de la mesa <U+201C>Datos ma<U+00F1>aneros, qu<U+00E9> son y para qu<U+00E9> sirven los #DatosAbiertos<U+201D>, Karla Ramos<U+2026> https://t.co/wFBYaUP68n | FALSE | 3 | NA | 05/03/18 16:29 | TRUE | NA | 9.70698E+17 | NA | Twitter for iPhone | CETGAPue | 2 | FALSE | FALSE | NA | NA |
| 2 | RT @Transparen_Xal: A unos minutos de empezar el Open Data Day Xalapa#ODD18 #Xalapa https://t.co/VH3m0QGeOJ | FALSE | 0 | NA | 05/03/18 16:28 | FALSE | NA | 9.70698E+17 | NA | Hootsuite | AytoXalapa | 1 | TRUE | FALSE | NA | NA |
| 3 | Nos encontramos ya en @ImacXalapa con @AytoXalapa para sumar esfuerzos a favor de la cultura de participaci<U+00F3>n ciuda<U+2026> https://t.co/VdIcF16Ub4 | FALSE | 0 | NA | 05/03/18 16:22 | TRUE | NA | 9.70696E+17 | NA | Twitter for Android | VERIVAI | 1 | FALSE | FALSE | NA | NA |
| 4 | A unos minutos de empezar el Open Data Day Xalapa#ODD18 #Xalapa https://t.co/VH3m0QGeOJ | FALSE | 0 | NA | 05/03/18 16:20 | FALSE | NA | 9.70696E+17 | NA | Twitter for iPhone | Transparen_Xal | 1 | FALSE | FALSE | NA | NA |
| 5 | El gobierno de @TonyGali promueve el uso de los #DatosAbiertos. Entra al portal https://t.co/Jz23xpJLAS y consult<U+2026> https://t.co/UoWP43R8Km | FALSE | 5 | NA | 05/03/18 16:09 | TRUE | NA | 9.70693E+17 | NA | Twitter for iPhone | CETGAPue | 4 | FALSE | FALSE | NA | NA |
For ease of analysis, and because the two data frames have the same columns, let’s merge the two datasets.
# combine dataframes from the two hashtags

alltweets_df <- rbind(tweets_opendataday_df, tweets_odd18_df)
write.csv(alltweets_df, file="data/allopendatadaytweets.csv")
Analysing the Data
Data analysis in R is quite a joy. We will use R’s dplyr package to analyse our data and answer a few questions:
- how many open data day attendees tweeted from android phones?
We can answer this using dplyr’s select() function, which as the name suggests, allows us to see only data we are interested in, in this case, tweets sent from the Twitter for Android app.
# install and load dplyr

install.packages(dplyr)
library(dplyr)

# find out number of open data day tweets from android phones

android_tweets <- filter(alltweets_df, grepl("Twitter for Android", statusSource))
tally(android_tweets)
# the result
n
1 51805,180 of the 14,955 (34.6%) #opendataday and #odd18 tweets were sent from android phones.
- Naturally, Open Data Day events cut across many topics and disciplines, and some events included hands-on workshop sessions or hackathons. Let’s find out which open data day tweets point to open source projects and resources that are available on GitHub.
 # open data day tweets that mention resources on GitHub

github_resources <- filter(alltweets_df, grepl("github.com", statusSource))
# the result
n
1 32Only 32 #opendataday and #odd18 tweets contain GitHub links.
- Not all open data day tweets are geotagged, but from the few that are, we can create a very basic map to show where people tweeted from. To do this, we will use the Leaflet library for R.
# install and load leaflet

install.packages(leaflet)
library(leaflet)

# create basic map
map <- leaflet() %>%
  addTiles() %>%
  addCircles(data = alltweets_df, lat = ~ latitude, lng = ~ longitude)

# view map
map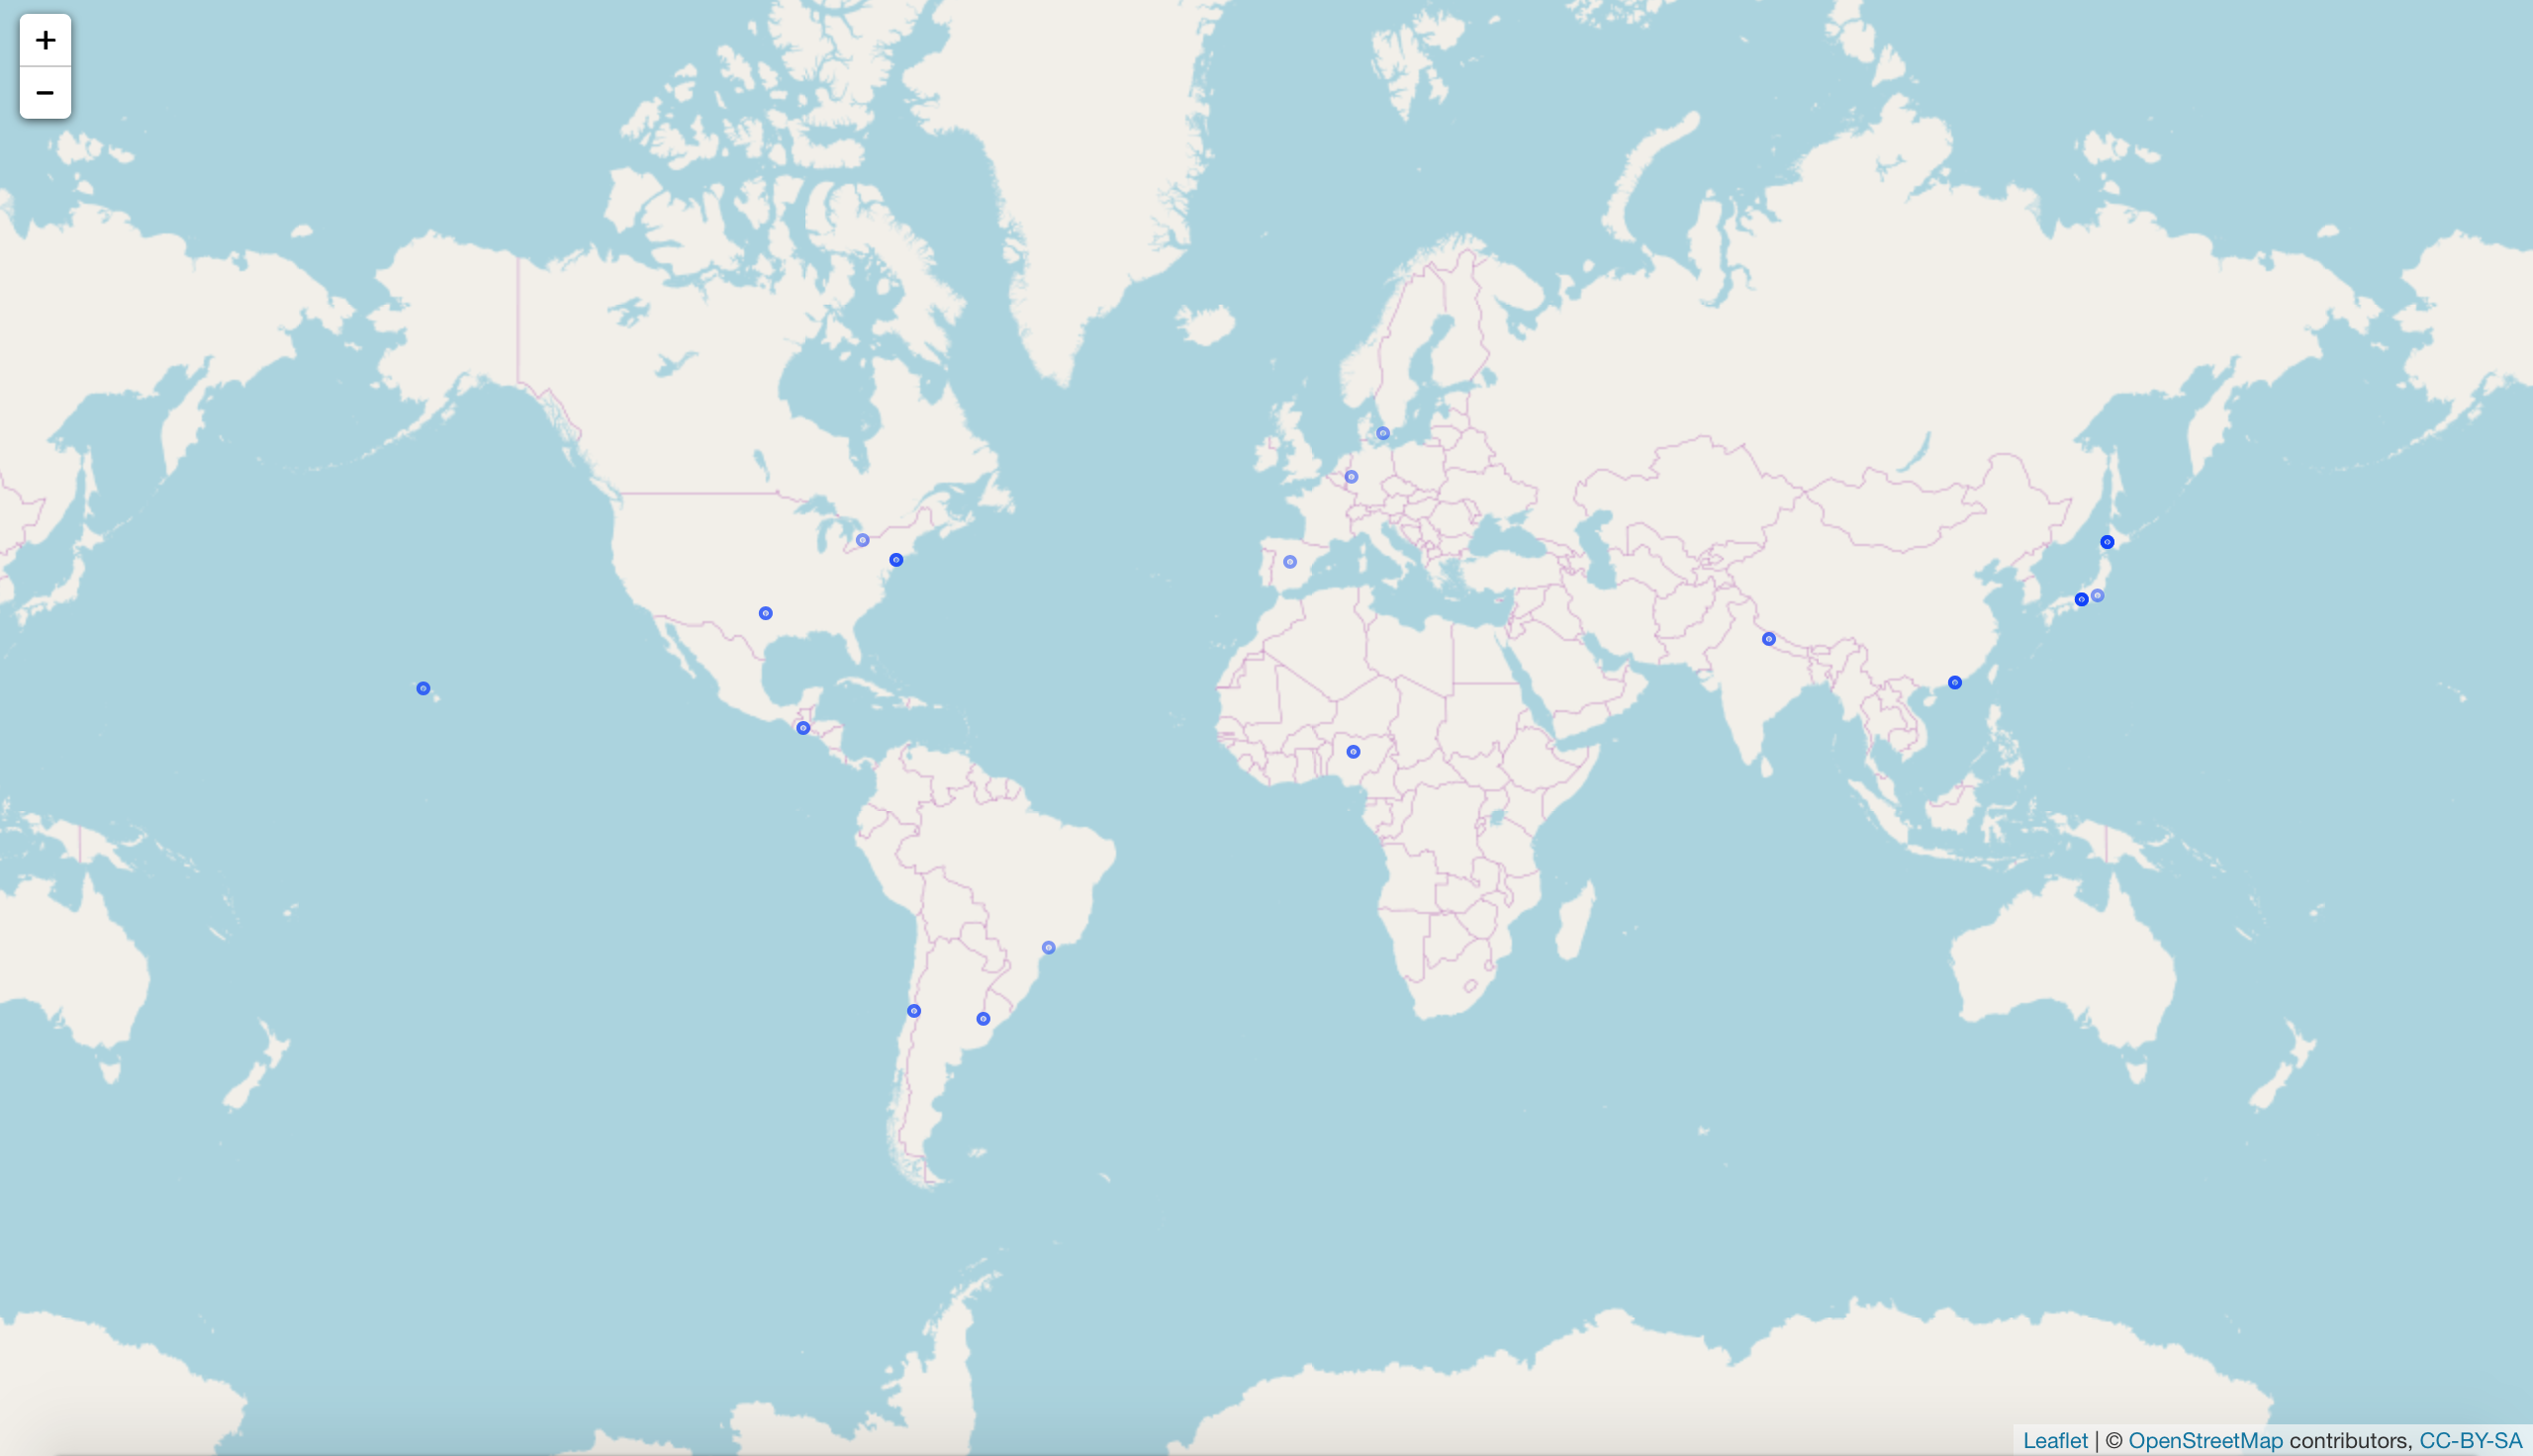
figure 1: map showing where geotagged #opendataday and #odd18 tweets originated from
Sharing the Data
Due to Twitter’s terms of use, we can only share a stripped-down version of the raw data. Our final dataset contains tweet IDs and retweet count, and will be packaged alongside this R script, so you could download the tweets yourself.
# filter out retweets and leave original tweets

  notretweets_df <- dplyr::filter(alltweets_df, grepl("FALSE", isRetweet))

# strip down tweets data to comply with Twitter's terms of use.

  subsetoftweets <- select(notretweets_df, id, retweetCount)
  write.csv(subsetoftweets, file="data/subsetofopendatadaytweets.csv")
Packaging the Data and associated resources
Providing context when sharing data is important, and Frictionless Data’s Data Package format makes it possible. Using datapackage.r, we can infer a schema for the all tweets CSV file and publish it alongside the other resources.
# specify filepath and infer schema
    filepath = '/data/subsetofopendatadaytweets.csv'

    schema = tableschema.r::infer(filepath)
Read more about the datapackage-r package in this post by Open Knowledge Greece.
Alternatively, we can use the Data Package Creator to package our data and associated resources.
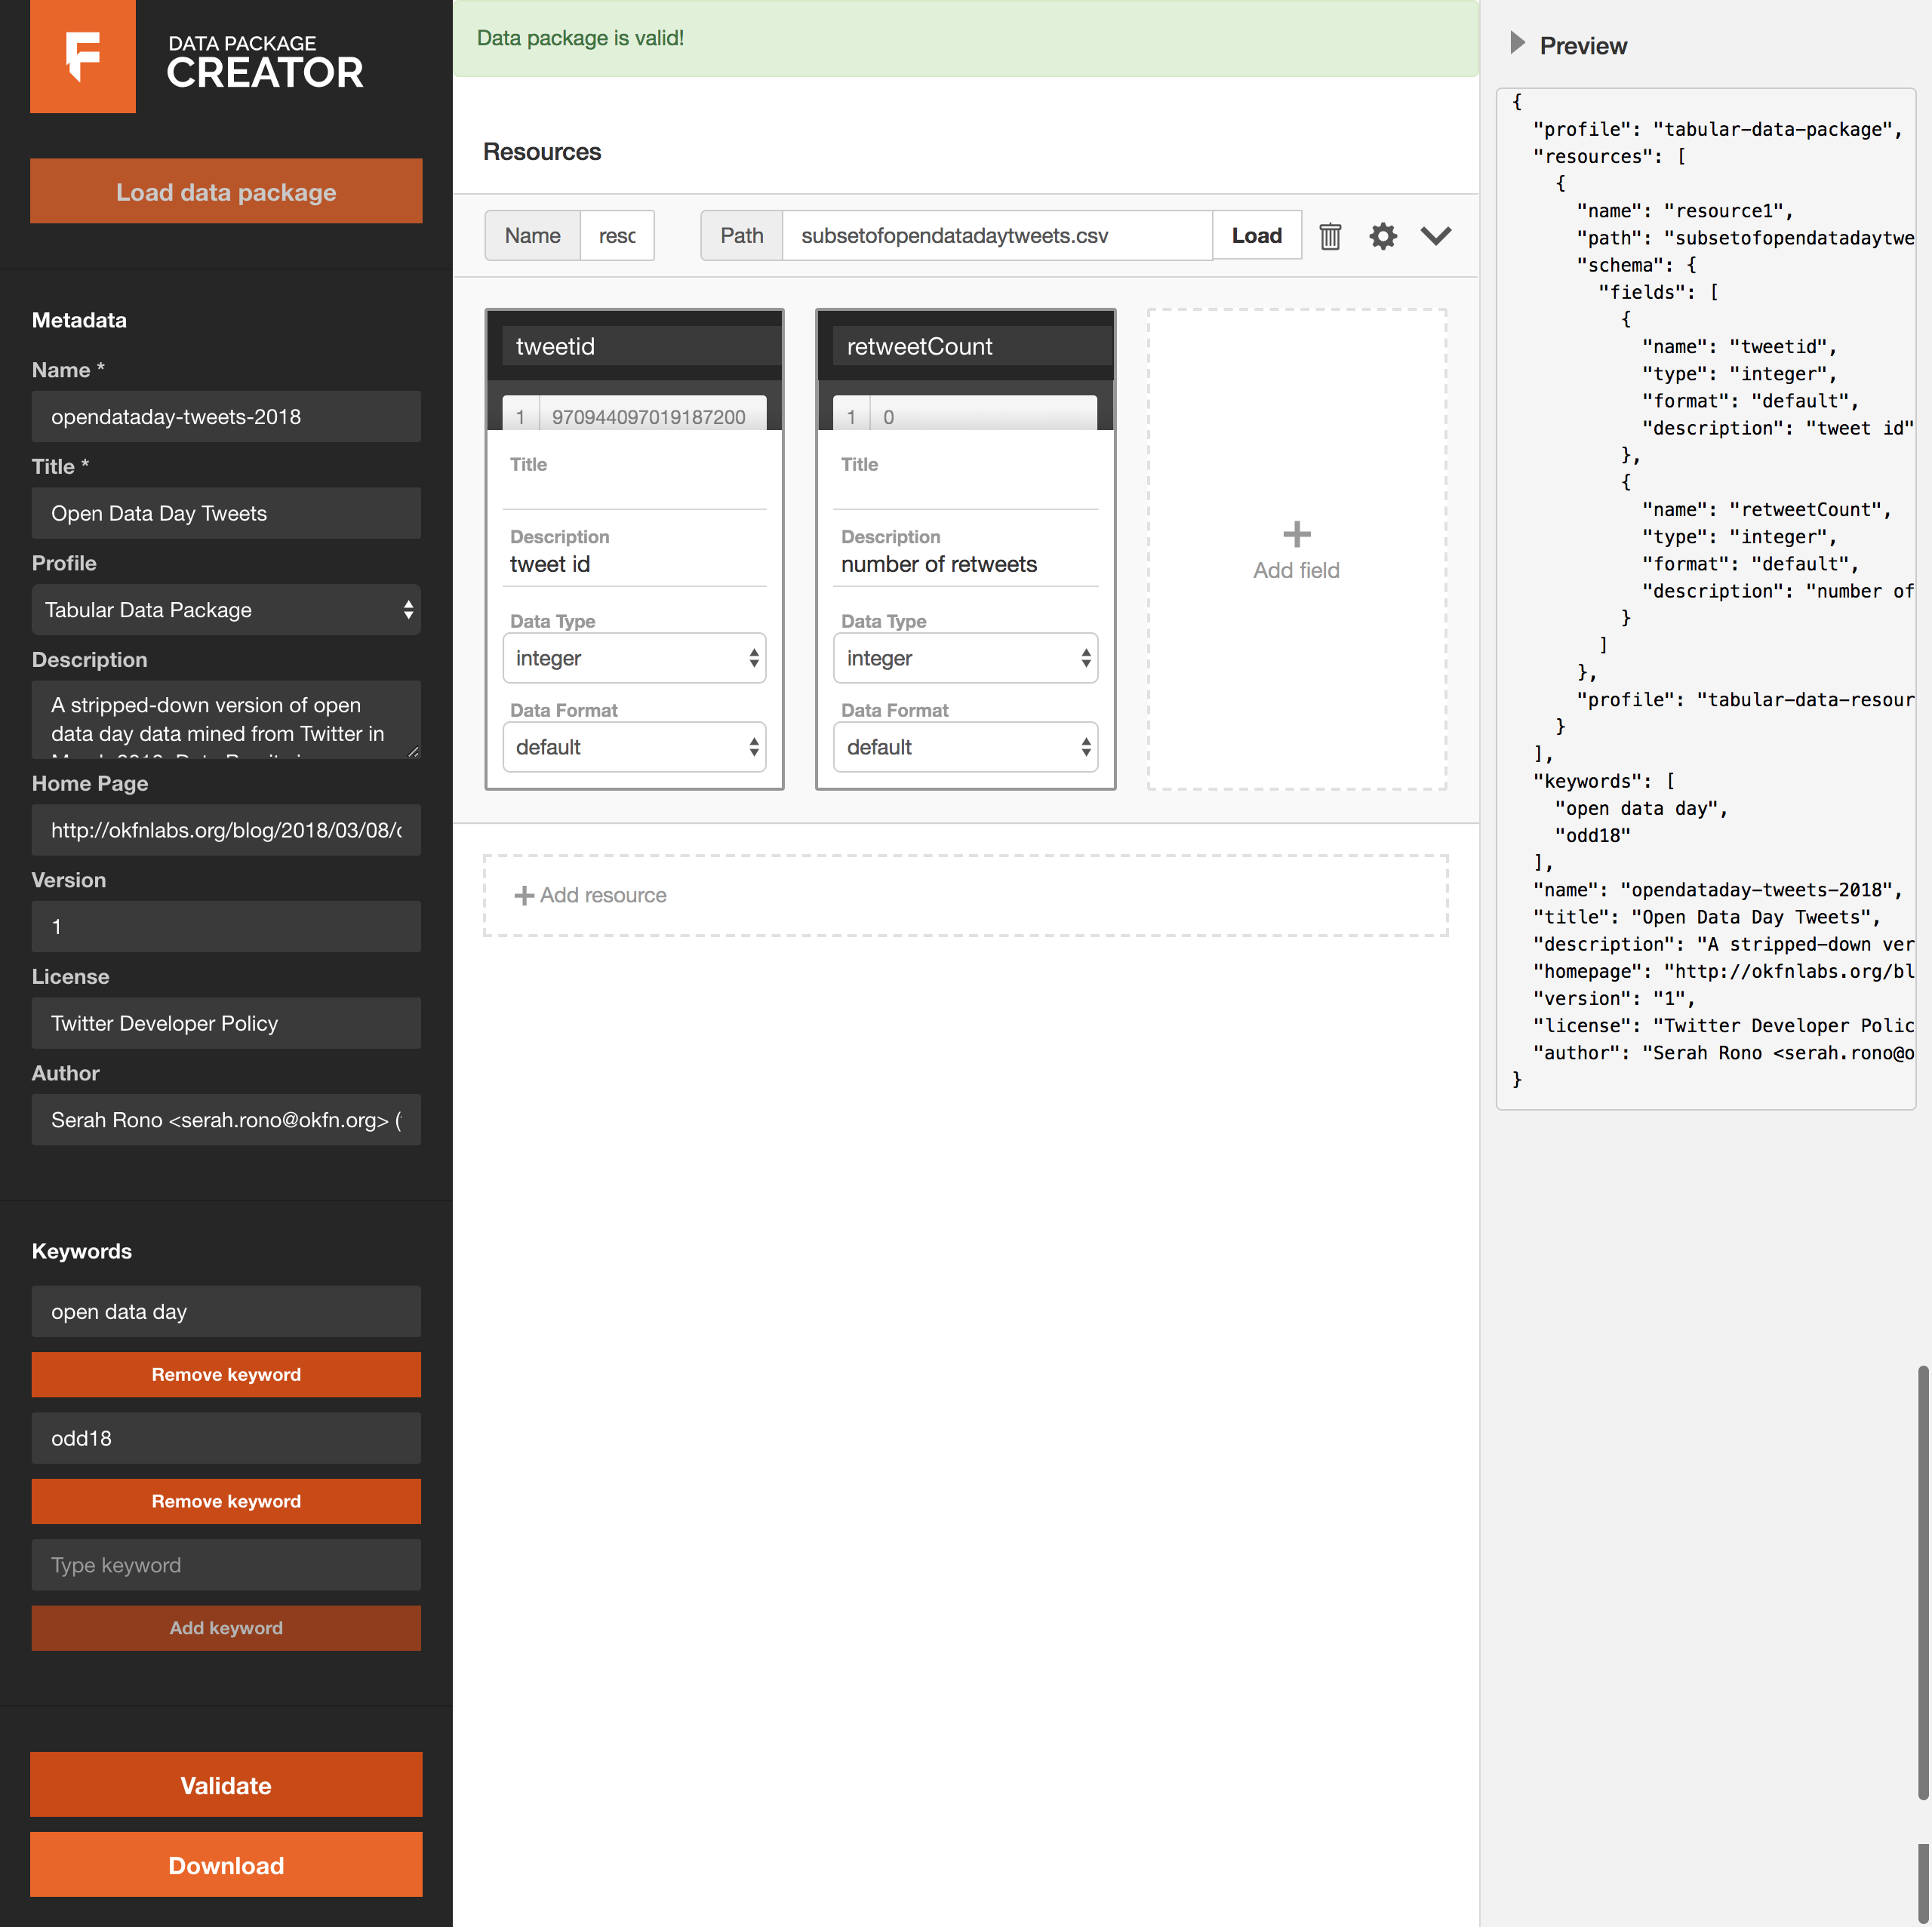
figure 2: creating the data package on Data Package Creator
Read more about the data package creator in this post.
Publishing on Github
Once our data package is ready, we can simply publish it to GitHub. Find the open data day tweets data package here.
Conclusion
Data Packages are a great format for sharing data collections with contextual information i.e. we added metadata and a schema to our final dataset. Read more about Data Packages in Frictionless Data and reach out in our community chat on Gitter.
 We make tools, apps and insights using
open stuff
We make tools, apps and insights using
open stuff


Comments